


Modern oscilloscopes are absurdly capable. They can capture gigasamples per second, decode half a dozen serial protocols in parallel, and trigger on events that last just a few nanoseconds. But ask many engineers how they feel sitting in front of one, and you’ll hear a different story and i.e. challenging but overwhelmed.
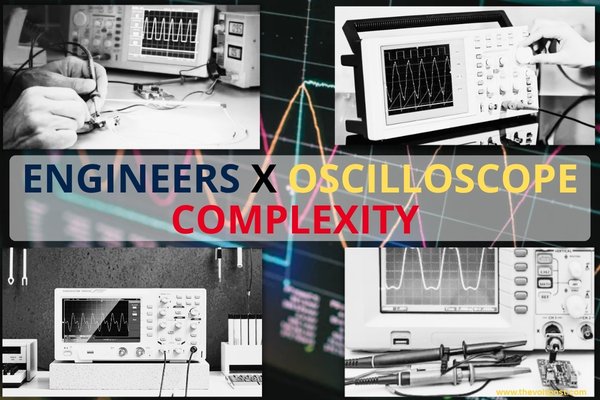
The instruments have become mini computers with touchscreens, nested menus, and dozens of overlapping ways to do the same thing. For new users, the sheer number of buttons and knobs is intimidating.
For experts, every new model seems to reshuffle the UI, forcing a fresh learning curve. And despite all the advanced features on offer, many engineers still live almost entirely in basic edge-trigger mode because everything else feels too fiddly to set up under pressure.
In a challenging debug session, complexity consumes time. Time spent hunting through menus is time not spent isolating the real problem on the board.
Where the Complexity Really Comes From
Feature overload and UI sprawl
Today’s DSOs and MSOs are packed with capabilities:
- Multiple analog and digital channels
- Deep memory and very high sample rates
- Dozens of automated measurements and math functions
- Protocol decode for I2C, SPI, CAN, LIN, PCIe, and more
- Advanced triggering (pulse width, runt, setup/hold, zone, pattern, serial-bus triggers)
All of this lives behind layers of menus, soft keys, and touch gestures. The result is a patchwork of control paths that differ from model to model and brand to brand.
Engineers have told vendors plainly:
- New users find traditional scopes intimidating because of the number of controls.
- The UI changes significantly between instruments, forcing relearning even for experienced users.
- Many advanced trigger modes go unused simply because they’re unfamiliar or hard to configure quickly.
Triggering – The most powerful and most avoided feature
The trigger system’s job is simple in theory, tell the scope what data to care about. In practice, it’s where complexity spikes.
Basic edge triggering is straightforward. But modern designs often demand more which is glitch capture, runt pulses, timing violations, burst patterns, and protocol-specific events. Parametric triggers – pulse width, rise/fall time, setup/hold, interval, zone are available, yet feedback suggests many engineers stick with edge triggering out of habit and ease-of-use concerns.
Setting up something like “edge-then-edge,” “Nth edge burst,” or a serial-bus trigger means juggling multiple parameters: source, slope, idle time, thresholds, coupling, and more. Under deadline pressure, it’s often faster to fall back to simple triggers and manually hunt for anomalies in long captures.
Data deluge and display bottlenecks
High-speed designs push scopes to their limits:
- Record lengths in the millions or billions of points
- High waveform update rates to catch rare events
- Simultaneous views: time domain, FFT, protocol decode, eye diagrams
But:
- Scopes may capture huge amounts of data yet display only a fraction on screen by default.
- Slow or laggy UIs make iterative adjustments frustrating, especially during live debugging.
- Engineers must balance sample rate, memory depth, and timebase to avoid aliasing, blind time, or missed events.
The irony is that the instruments can see everything, but the engineer can’t easily make sense of it all.
Probing and setup pitfalls that compound the problem
Even a top-tier scope can’t fix bad probing:
- Uncompensated probes, long ground leads, and large loop areas introduce ringing and measurement error.
- Wrong bandwidth or sample-rate settings can hide details or add noise.
- Inadequate vertical scaling (not filling the screen) reduces effective resolution and measurement accuracy.
These issues are well-documented in application notes and best-practice guides, but they’re easy to overlook when you’re racing to reproduce a failure.
How Engineers Are Cutting Through the Complexity
The answer isn’t to avoid advanced features. It’s to use a smaller set of them, more intentionally, so they save time instead of consuming it.
Start with a clear measurement question
Before touching the scope, many test engineers now force themselves to answer three questions:
- What am I trying to measure or prove? (e.g., “Is there a sub-10 ns droop on this rail?” or “Is setup/hold violated on this DDR line?”)
- What’s the fastest relevant frequency or edge in my system?
- Do I need analog detail, digital timing, protocol decode, or all three?
That clarity drives better choices:
- Bandwidth and sample rate (a common rule of thumb: 3–5× the fundamental or clock frequency)
- Number and type of channels (analog vs. digital/MSO)
- Which features actually matter for this session, instead of diving into every menu “just in case.”
Build a personal “trigger toolkit”
Instead of skimming every trigger type, experienced users are picking a handful that match their work and learning them deeply:
- Edge triggering – for stable, repetitive waveforms.
- Pulse width / glitch triggering – to catch narrow spikes or unexpected pulses.
- Runt triggering – for partial swings that don’t reach full logic levels.
- Setup/hold triggering – for digital timing violations on buses and memory interfaces.
- Zone or area triggering (where available) – to trigger on anything that enters a drawn region on the display, simplifying complex event capture.
A common workflow:
- Run with infinite persistence in edge mode first to see if anomalies exist at all.
- Estimate how often the event occurs, then choose a trigger mode that isolates it (e.g., glitch or interval trigger).
- Save those setups as presets or templates for future sessions.
Over time, this turns a bewildering menu into a small, reliable toolkit that travels from project to project.
Use search, navigation, and segmented memory
Modern scopes offer features specifically designed to handle long captures without drowning the user:
- Search and navigation – scan long records for specific events (edges, pulses, protocol frames) and jump between them.
- Segmented memory – store only the relevant triggered events instead of one giant record, making review and analysis faster.
A practical pattern many teams are adopting:
- Set a relatively simple trigger that captures the event class you care about.
- Enable segmented memory to collect many occurrences.
- Use search/navigation to review only the interesting segments instead of scrolling through megapoints of data.
This reduces cognitive load and makes rare events easier to study.
Dial in vertical and horizontal settings for clarity
A few disciplined habits dramatically improve measurement quality and reduce confusion:
- Fill the screen vertically without clipping. This maximizes effective resolution and SNR.
- Use averaging for repetitive waveforms to reduce noise and sharpen edges.
- Enable high-resolution or HD modes (if your scope has them) for cleaner, low-noise views of slower signals.
- Match bandwidth limit filters to your signal to suppress out-of-band noise.
These settings are simple, but they’re often overlooked when menus are overwhelming.
Treat probing as part of the measurement, not an afterthought
Good probing is the single biggest “complexity reducer” in practice:
- Always compensate 10× probes for the specific scope input you’re using.
- Minimize ground lead length and loop area; use short ground springs or dedicated probe sockets for high-frequency work.
- Be mindful of probe loading (capacitance and resistance) on sensitive nodes.
- Use differential probes or isolated channels when measuring across non-ground-referenced nodes or high-side rails.
A clean, well-probed signal makes every other setting easier to interpret and reduces the temptation to “fix” problems in the scope that are actually probing artifacts.
Standardize workflows and save presets
To fight UI inconsistency across instruments, many engineers are building personal playbooks:
- A checklist for common tasks:
- Probe compensation check
- Vertical scale and offset
- Bandwidth and sample rate
- Trigger type and coupling
- Measurement parameters (rise time, overshoot, jitter, etc.)
- Saved scope setups (or screenshots of key settings) for recurring measurements: power-up sequences, switching-node waveforms, protocol captures, etc.
- Documented “go-to” trigger and measurement configurations for specific design blocks (DC-DC converters, SERDES lanes, MCU GPIOs, etc.).
Over time, this turns a complex instrument into a repeatable measurement platform.
Use training resources but stay focused
Manufacturers and the community offer rich materials:
- Vendor tutorials on triggering, protocol decode, and best practices.
- Application notes on making better measurements and avoiding common mistakes.
- Community videos demonstrating advanced triggering on real glitch/runt/interval problems.
The trick is to avoid getting lost:
- Pick one topic at a time (e.g., “glitch triggering” or “DDR setup/hold”).
- Practice on a known-good signal or a deliberately injected fault.
- Immediately apply what you learn to a real design issue so it sticks.
A Real-World Example: Hunting a Rare Glitch on a Power Rail
Consider a common scenario like a 3.3 V rail that occasionally drops for a few nanoseconds, causing an MCU to reset at random.
A focused workflow might look like this:
- Define the question: “Is there a sub-10 ns droop on the 3.3 V rail, and how often does it happen?”
- Probe properly: Use a well-compensated 10× probe with a short ground spring; minimize loop area.
- Set vertical and bandwidth: Scale to fill the screen around 3.3 V; enable an appropriate bandwidth limit to reduce noise.
- Use infinite persistence: Run in edge-trigger mode to see if any outliers appear over time.
- Switch to glitch/pulse-width trigger: Configure for narrow negative pulses below a certain width.
- Enable segmented memory: Capture many glitch events instead of one long record.
- Use search/navigation: Jump between captured glitches, measure their width and depth, and correlate with system behavior.
Instead of wrestling with every menu, you follow a focused path that uses just a few advanced features effectively.
Advanced oscilloscopes are complex because modern designs are complex. The instruments have grown to match the challenges of high-speed digital, power electronics, and mixed-signal systems.
The way engineers are overcoming that complexity isn’t by avoiding advanced features, but by:
- Clarifying what they’re trying to measure.
- Mastering a small, relevant set of trigger and analysis tools.
- Optimizing probing and basic settings before diving into deep menus.
- Building repeatable workflows and presets that travel from scope to scope.